Providing Personal Real Estate Services For Vancouver East, West & Downtown Properties

Fill in the criteria above do a quick search of the Vancouver market.

Crystal ball with Vancouver market questions

How Is The Vancouver Market?

The questions above are some of the many questions I get about the real estate market in Vancouver. The answers to these questions are constantly changing.


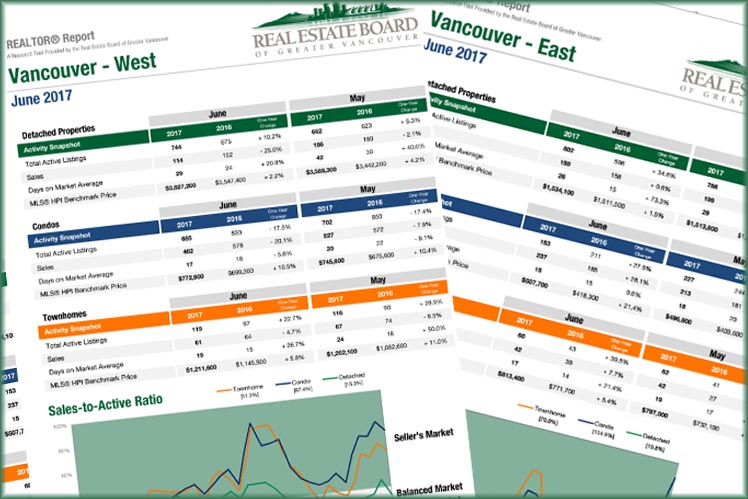
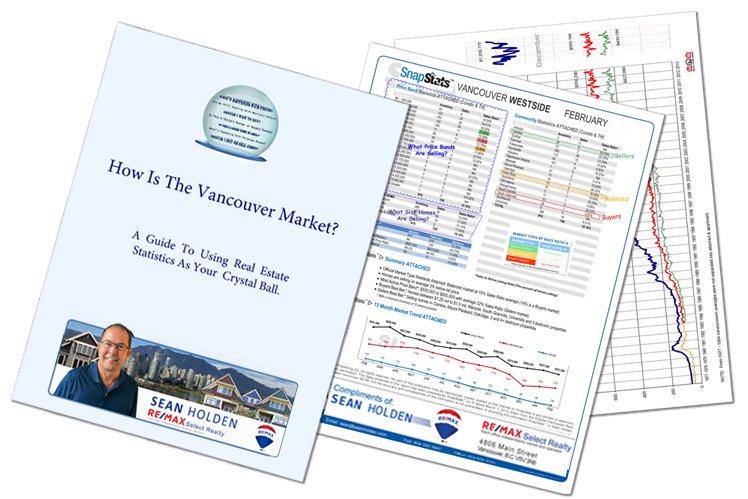
I continuously review real estate news and financial news together with real estate sales and listing statistics to help keep my finger on the pulse of the Vancouver market.


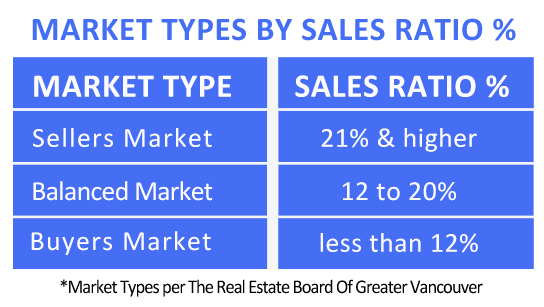
The basic law of 'Supply and Demand' is what determines house pricing. An increased supply of homes and less demand from buyers will mean a ‘Buyers Market’ and lead to lower pricing. A decrease in supply and more demand from buyers means a ‘Sellers Market’ and higher home prices. A balance between the supply and demand from buyers means a ‘Balanced Market’ with prices remaining more stable.


The Real Estate Board Of Greater Vancouver identifies the market types using the Sales Ratio % (Sales to Active Listings Ratio). The number of Sales divided by the number of Active Listings x 100 = Sales Ratio %. For Example, a sales ratio of 33% means 1 in 3 homes are selling and this would be a Sellers Market; a sales ratio of 10% means 1 in 10 homes are selling and this would be a Buyers Market.


Supply and demand and hence pricing in the real estate market changes due to many factors including the economy/employment, political uncertainty, interest rates, mortgage rules and seasons (spring, summer, fall and winter markets).


While I do not have a crystal ball, details of Sales Ratios, Median Prices, Days On Market, List To Price Ratios for Attached and Detached homes by area and sub-area together with a picture of how these numbers are trending all tell a story and help to answer many of the questions above.


Listing & Sales Statistics

Reports for The Real Estate Board of Greater Vancouver real estate listing and sales statistics can be viewed at the links in the table below. The linked page displays the most current version of the report for the selected area and updates automatically:


Vancouver Westside


Burnaby North

Vancouver Eastside


Burnaby South

North Vancouver


Burnaby East

• West Vancouver


New Westminster

Coquitlam


Metro Vancouver

Port Coquitlam


Port Moody

Richmond


*** If there are other market areas that interest you, please email me at sean@seanholden.com 


Sean's Monthy Report

Meanwhile, if you like these reports and you would like to keep up to date on what is going on in the market, I will be happy to share my detailed monthly sales reports with you along with real estate news of changes in rules and mortgage rate indicators or other factors that may affect your selling and/or buying decisions.


Please complete the request form below and I will be happy to add you to my email list.

There is no obligation and you can discontinue at any time: 

Vancouver Market Monthly Update Request

I would like to receive Sean's Monthly Vancouver Real Estate Market Report
***I will not call you without your permission.
Reciprocity Logo The data relating to real estate on this website comes in part from the MLS® Reciprocity program of either the Greater Vancouver REALTORS® (GVR), the Fraser Valley Real Estate Board (FVREB) or the Chilliwack and District Real Estate Board (CADREB). Real estate listings held by participating real estate firms are marked with the MLS® logo and detailed information about the listing includes the name of the listing agent. This representation is based in whole or part on data generated by either the GVR, the FVREB or the CADREB which assumes no responsibility for its accuracy. The materials contained on this page may not be reproduced without the express written consent of either the GVR, the FVREB or the CADREB.